 TemperateReefBase Geonetwork Catalogue
oceans
Type of resources
Topics
Keywords
Contact for the resource
Provided by
Years
-
This study considered a range of water-column and sediment (benthos) based variables commonly used to monitor estuaries,utilising estuaries on the North-West Coast of Tasmania (Duck, Montagu, Detention, and Black River). These included: salinity, dissolved oxygen, turbidity, nutrient and chlorophyll a levels for the water-column; and sediment redox, organic carbon content, chlorophyll a and macroinvertebrate community structure amongst the benthos. In addition to comparing reference with impacted estuaries, comparisons were also made across seasons, commensurate with seasonal changes in freshwater river input, and between regions within estuaries (upper and lower reaches) - previously identified in Hirst et al. (2005). This design enabled us to examine whether the detection of impacts (i.e. differences between reference and impacted systems) was contingent on the time and location of sampling or independent of these factors. The data represented by this record was collected in the Duck Bay.
-
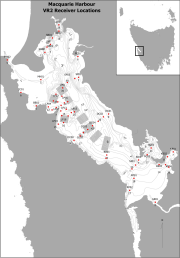
Fixed position oxygen and water temperature logger data from the Macquarie Harbour World Heritage Area (WHA). Two Hobo oxygen data loggers are positioned at approximately 15 m depth at different sites within the WHA, with the intent of monitoring representative mid-bottom water oxygen values in the WHA as these were identified in previous studies to be naturally low due to limited seawater exchange at the harbour entrance, and thus likely to be most susceptible to anthropogenic factors that may increase oxygen demand and alter WHA conservation values. These values include core habitat of the Maugean Skate, a listed threatened species. This work is funded by WHA advisory board via the Nature Conservation Branch of DPIPWE and is part of a larger study being conducted by IMAS undertaking a biological baseline study of the biodiversity of the Macquarie Harbour WHA. This data spans 08/11/14 to present (most recent update 02/02/17).
-
Water quality and biological data was collected from four tide-dominated river estuaries indicative of catchments with varying levels of human impacts to: 1) assess draft indicator levels for water quality, and 2) investigate biological indicators of estuarine health in NW Tasmania. The data represented by this record was collected in the Black River.
-
We implemented a monitoring program developed by Crawford and White (2006), which was designed to assess the current condition of six key estuaries in NW Tasmania: Port Sorell, the Leven, Inglis, Black, Montagu and Arthur River estuaries. This study considered a range of water quality and ecological indictors commonly used to monitor estuaries. These included: salinity, temperature, dissolved oxygen, turbidity, pH, nutrients (nitrate + nitrite, dissolved reactive phosphorus and ammonia), silica molybdate reactive and chlorophyll a for the water column; chlorophyll a and macroinvertebrate community structure amongst the sediments. The data represented by this record was collected in Black River.
-
We implemented a monitoring program developed by Crawford and White (2006), which was designed to assess the current condition of six key estuaries in NW Tasmania: Port Sorell, the Leven, Inglis, Black, Montagu and Arthur River estuaries. This study considered a range of water quality and ecological indictors commonly used to monitor estuaries. These included: salinity, temperature, dissolved oxygen, turbidity, pH, nutrients (nitrate + nitrite, dissolved reactive phosphorus and ammonia), silica molybdate reactive and chlorophyll a for the water column; chlorophyll a and macroinvertebrate community structure amongst the sediments. The data represented by this record was collected in Inglis River.
-
Water quality and biological data was collected from four tide-dominated river estuaries indicative of catchments with varying levels of human impacts to: 1) assess draft indicator levels for water quality, and 2) investigate biological indicators of estuarine health in NW Tasmania. The data represented by this record was collected in the Detention River.
-
Water quality and biological data was collected from four tide-dominated river estuaries indicative of catchments with varying levels of human impacts to: 1) assess draft indicator levels for water quality, and 2) investigate biological indicators of estuarine health in NW Tasmania. The data represented by this record was collected in the Montagu River.
-
We implemented a monitoring program developed by Crawford and White (2006), which was designed to assess the current condition of six key estuaries in NW Tasmania: Port Sorell, the Leven, Inglis, Black, Montagu and Arthur River estuaries. This study considered a range of water quality and ecological indictors commonly used to monitor estuaries. These included: salinity, temperature, dissolved oxygen, turbidity, pH, nutrients (nitrate + nitrite, dissolved reactive phosphorus and ammonia), silica molybdate reactive and chlorophyll a for the water column; chlorophyll a and macroinvertebrate community structure amongst the sediments. The data represented by this record was collected in Port Sorell.
-
This study considered a range of water-column and sediment (benthos) based variables commonly used to monitor estuaries,utilising estuaries on the North-West Coast of Tasmania (Duck, Montagu, Detention, and Black River). These included: salinity, dissolved oxygen, turbidity, nutrient and chlorophyll a levels for the water-column; and sediment redox, organic carbon content, chlorophyll a and macroinvertebrate community structure amongst the benthos. In addition to comparing reference with impacted estuaries, comparisons were also made across seasons, commensurate with seasonal changes in freshwater river input, and between regions within estuaries (upper and lower reaches) - previously identified in Hirst et al. (2005). This design enabled us to examine whether the detection of impacts (i.e. differences between reference and impacted systems) was contingent on the time and location of sampling or independent of these factors. The data represented by this record was collected in the Black River.
-
This study considered a range of water-column and sediment (benthos) based variables commonly used to monitor estuaries,utilising estuaries on the North-West Coast of Tasmania (Duck, Montagu, Detention, and Black River). These included: salinity, dissolved oxygen, turbidity, nutrient and chlorophyll a levels for the water-column; and sediment redox, organic carbon content, chlorophyll a and macroinvertebrate community structure amongst the benthos. In addition to comparing reference with impacted estuaries, comparisons were also made across seasons, commensurate with seasonal changes in freshwater river input, and between regions within estuaries (upper and lower reaches) - previously identified in Hirst et al. (2005). This design enabled us to examine whether the detection of impacts (i.e. differences between reference and impacted systems) was contingent on the time and location of sampling or independent of these factors. The data represented by this record was collected in the Detention River.